In this guide, we are going to learn how use Conduit's stream inspector. Stream inspection is available via the Conduit UI and the API.
UI
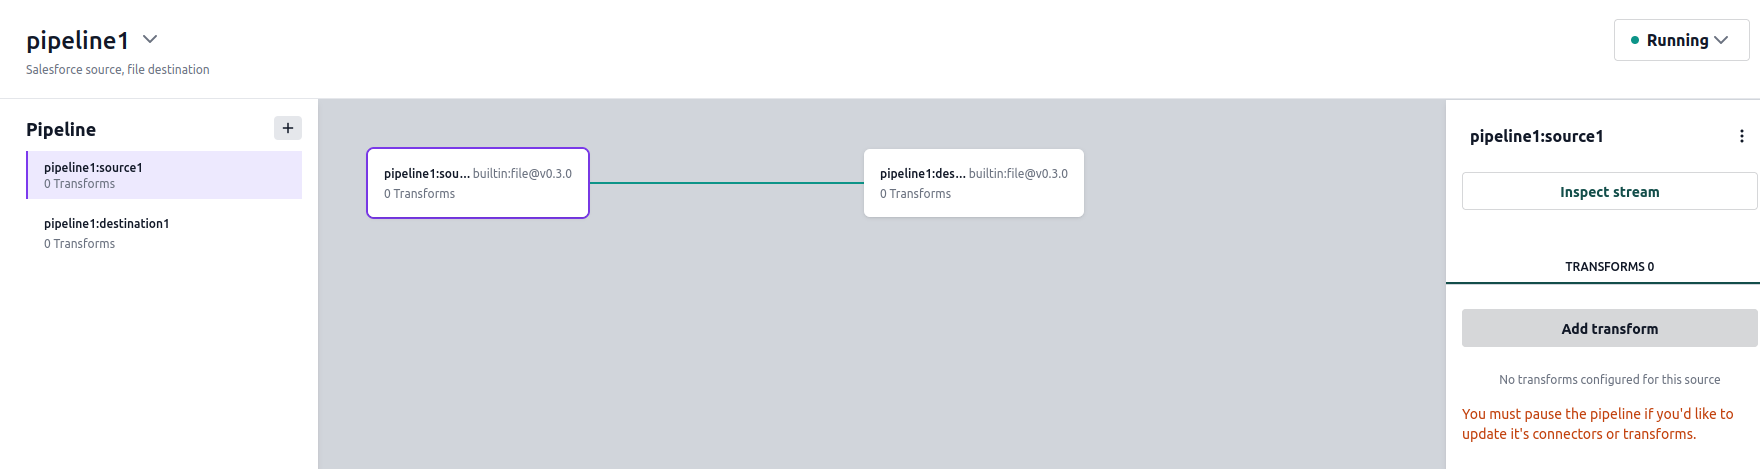
To access the stream inspector through the UI, first navigate to the pipeline which you'd like to inspect. Then, click on the connector in which you're interested. You'll see something similar to this:
Click the "Inspect Stream" button to start inspecting the connector. A new pop-up window will show the records:
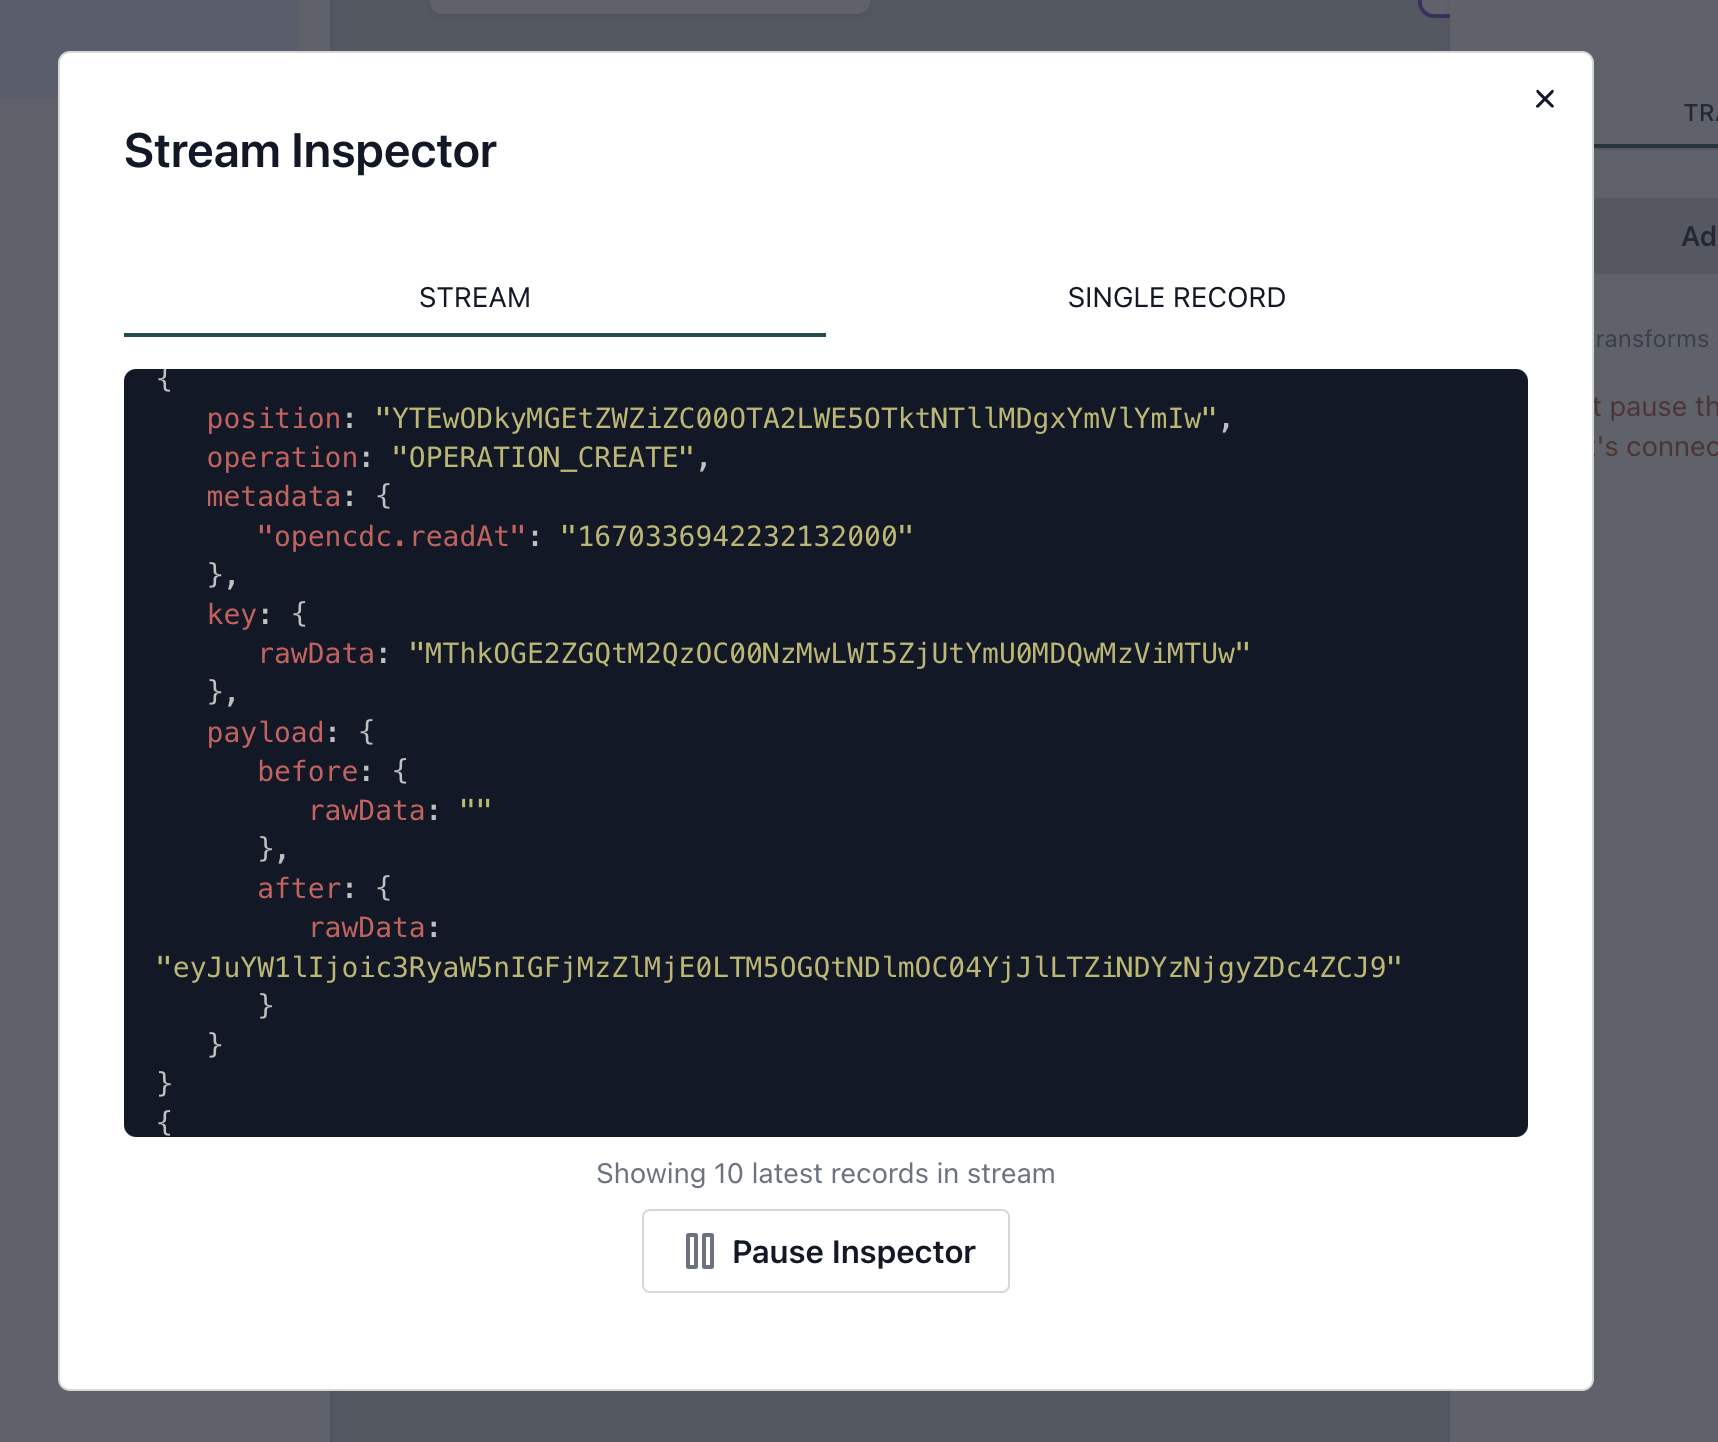
On the "Stream" tab you'll see the latest 10 records. If you switch to the "Single record" view, only the last record will be shown. You can use the "Pause" button to pause the inspector and stop receiving the latest record(s). The ones that are already shown will be kept so you can inspect them more thoroughly.
API
To access the stream inspector through the API, you'll need a WebSocket client (for example wscat).
The URL on which the inspector is available comes in the following format: ws://host:port/v1/connectors/<connector ID>/inspect.
For example, if you run Conduit locally with the default settings, you can inspect a connector by running the following
command:
$ wscat -c ws://localhost:8080/v1/connectors/pipeline1:destination1/inspect | jq .
{
  "result": {
    "position": "NGVmNTFhMzUtMzUwMi00M2VjLWE2YjEtMzdkMDllZjRlY2U1",
    "operation": "OPERATION_CREATE",
    "metadata": {
      "opencdc.readAt": "1669886131666337227"
    },
    "key": {
      "rawData": "NzQwYjUyYzQtOTNhOS00MTkzLTkzMmQtN2Q0OWI3NWY5YzQ3"
    },
    "payload": {
      "before": {
        "rawData": ""
      },
      "after": {
        "structuredData": {
          "company": "string 1d4398e3-21cf-41e0-9134-3fe012e6d1fb",
          "id": 1534737621,
          "name": "string fbc664fa-fdf2-4c5a-b656-d52cbddab671",
          "trial": true
        }
      }
    }
  }
}
The above command also uses jq to pretty-print the output. You can also use jq to decode Base64-encoded strings,
which may represent record positions, keys or payloads:
wscat -c ws://localhost:8080/v1/connectors/pipeline1:destination1/inspect | jq '.result.key.rawData |= @base64d'